SARS-CoV-2 Fitness Tracker for North Carolina
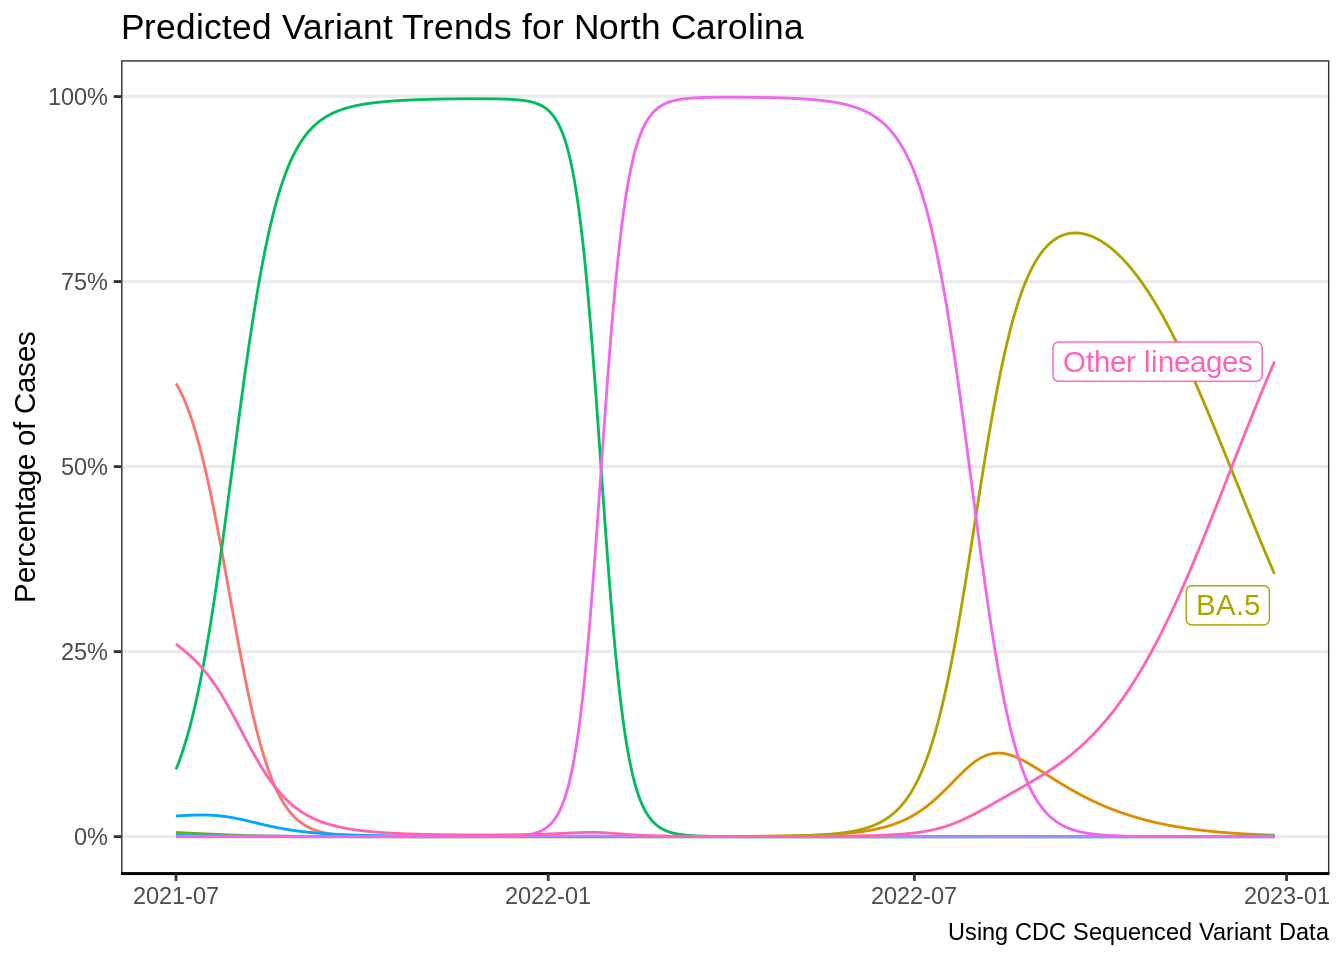
Below represents the fitted variant progression in North Carolina.
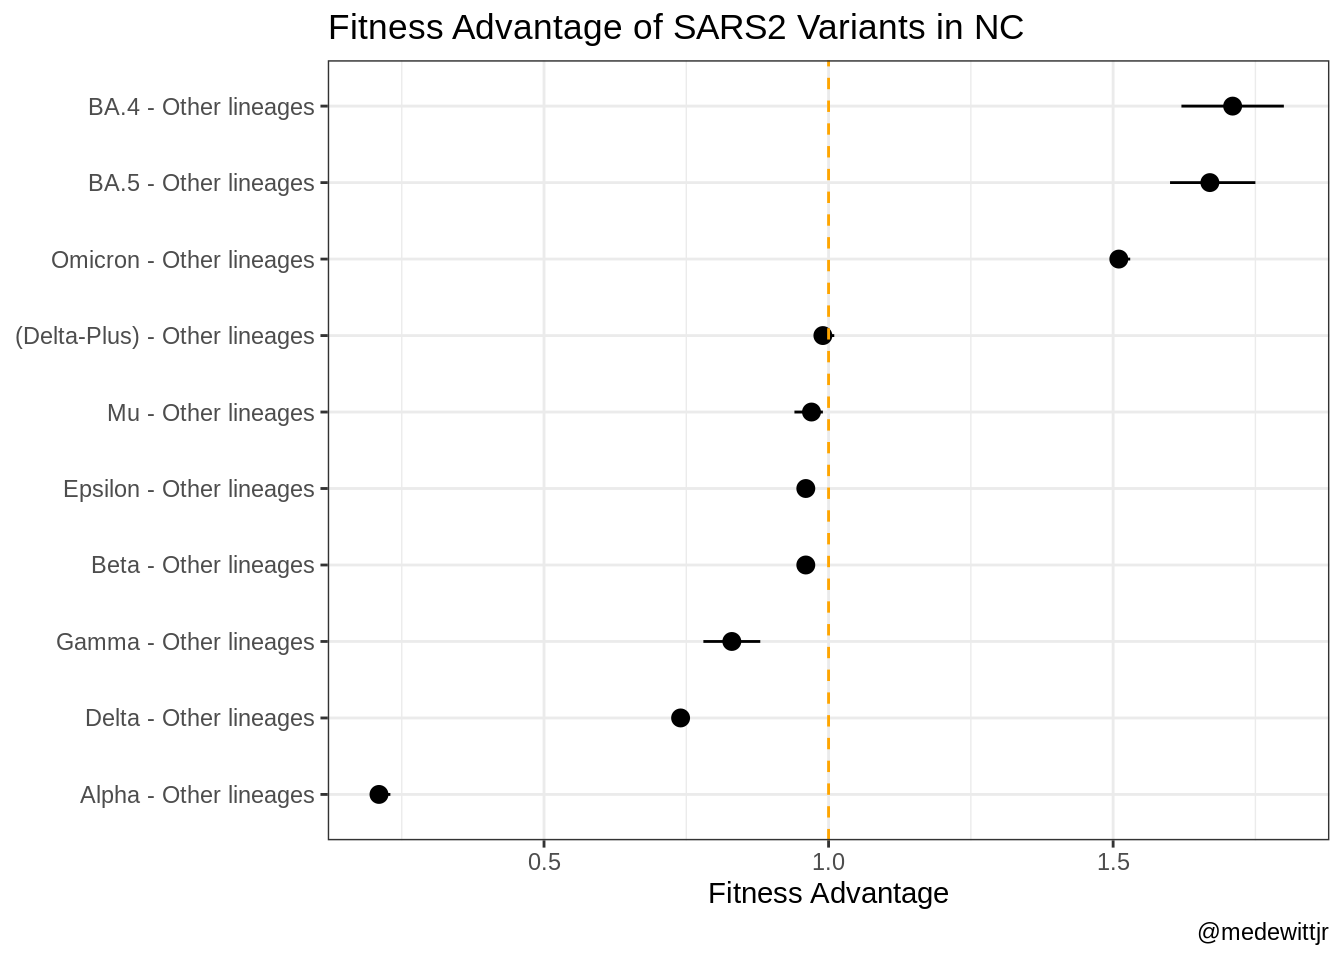
The below table represents the estimate growth rate advantages of the different variants over wild-type variants. Values greater than one indicate an advantage over the wild-type. This assumes a generation time of 4.7 days.
| Contrast | Estimate | Lower | Upper |
|---|---|---|---|
| Alpha - Other lineages | 0.21 | 0.20 | 0.23 |
| Beta - Other lineages | 0.96 | 0.95 | 0.97 |
| Delta - Other lineages | 0.74 | 0.73 | 0.75 |
| (Delta-Plus) - Other lineages | 0.99 | 0.98 | 1.01 |
| Gamma - Other lineages | 0.83 | 0.78 | 0.88 |
| Epsilon - Other lineages | 0.96 | 0.95 | 0.97 |
| Mu - Other lineages | 0.97 | 0.94 | 0.99 |
| Omicron - Other lineages | 1.51 | 1.50 | 1.53 |
| BA.4 - Other lineages | 1.71 | 1.62 | 1.80 |
| BA.5 - Other lineages | 1.67 | 1.60 | 1.75 |