Chapter 7 Maps and Geospatial Analysis
Space, the final frontier. - Gene Roddenberry
7.1 Map It!
So much of who we are is shaped by our origin. Knowing someone’s home encodes so much information…did I grow up in a city. IF the answer is yes we start to think about all of the things about cities–perhaps I road the public transit system, perhaps I saw lots of concerts and shows, perhaps I am liberal, I don’t have a driver’s license. Versus I am from a rural southern town in the united states. Now does our mental paradigm shift? Yes, of course. Now we can argue that these are stereotypes. I don’t disagree. But there is so much information in geography and sometimes the best way to explore it is to see it manifested in a map. This map may then lead to much better analysis through thinking about regional differences and factors versus just looking at the large picture.
7.2 Like the census!
The US census provides a great deal of information available for access both through download and through API interface. Beyond the decenniel census there is the American Community Survey (ACS) that is the long form census questions applied more frequently to roughly 900k per year.
## To install your API key for use in future sessions, run this function with `install = TRUE`.library(tidycensus)
library(tidyverse)
library(viridis)
library(sf)
county_pov <- get_acs(geography = "county",
variables = "B17001_002",
summary_var = "B17001_001",
geometry = TRUE,
shift_geo = TRUE) %>%
mutate(pctpov = 100* estimate/ summary_est)## Getting data from the 2012-2016 5-year ACS## Using feature geometry obtained from the albersusa package## Please note: Alaska and Hawaii are being shifted and are not to scale.ggplot(county_pov)+
geom_sf(aes(fill = pctpov), color = NA)+
coord_sf(datum = NA)+
labs(
title = " Percent of the Population In Poverty",
subtitle = "2012-2016 American Community Survey",
caption = "Data from R tidycensus package",
fill = "% in poverty"
)+
scale_fill_viridis()+
theme_void()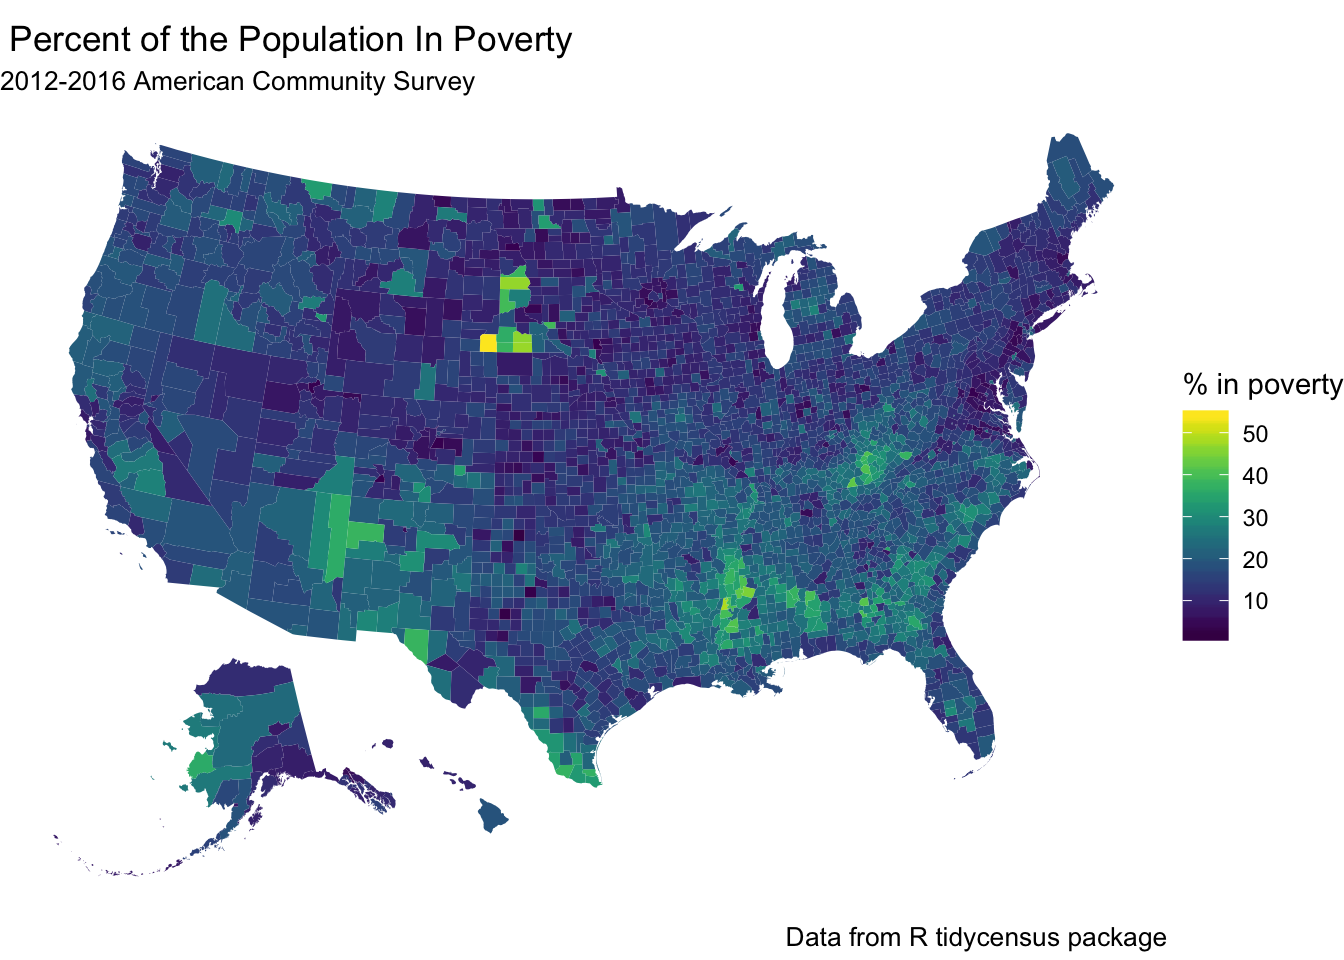
7.3 So What?
Spatial analysis allows idetnification of patterns that might not be easily visisble in the raw data. Additionally, it helps encode data for digestion.